This article is a first in a series of three articles which will be posted in the near future. This work will briefly cover some complex concepts. Dear beginners do not worry! This series are written for a broad audience and not limited to experts in price valuation. The average Joe should be able to grasp the main idea.
Pricing
Many of us invested in something in our lives, be it stocks, bonds or a house that we live in. But there is always a question: what is the right price, or how much to pay? It is a very common question that many people ask, but few can really tell, or at least make some rational estimate.
This question is relevant in any market conditions: in a bear market, in a bull market, in high and low inflation, in free or a controlled market, in all the sectors and pillars of the economy – always!
These days, we are witnessing markets in their all-times high. Many experienced investors are worried of an overheated market with prices too high. They are afraid of a correction or even a bubble that might burst and leave them with heavy losses.
On the other hand, we also witness many unexperienced investors (or better call them, opportunistic traders), that are not afraid of risk, who are willing to buy pretty much any popular stock for any price, for as long as the company is loved and admired by the masses.
Who is right? Who is wrong?
Is it possible that both are wrong? Is it possible that both are right?

I will stop talking in riddles now and try to make some sense in all of this.
In this series of articles, I will try to outline some guidelines on how to determine the fair value of an investment. I will talk about the usual methods, such as a DCF valuation or valuations based on ratios (PE ratio, EV/EBITDA, etc.), and why they are no longer as credible as they used to be.
After a short discussion about the limitations of each method, I will try to demonstrate the effect of noise traders (aka volatility traders, aka Robinhood traders) and how disruptive technologies are in the middle of all this. Finally, I will share my thoughts on how to make investment decisions in our current modus operandi.
Professional valuation methods
I call it professional, because these methods are used by professionals. It doesn’t mean that they are always accurate and lead to best results.
Let’s start with the most fundamental method: Discounted Cash Flows.
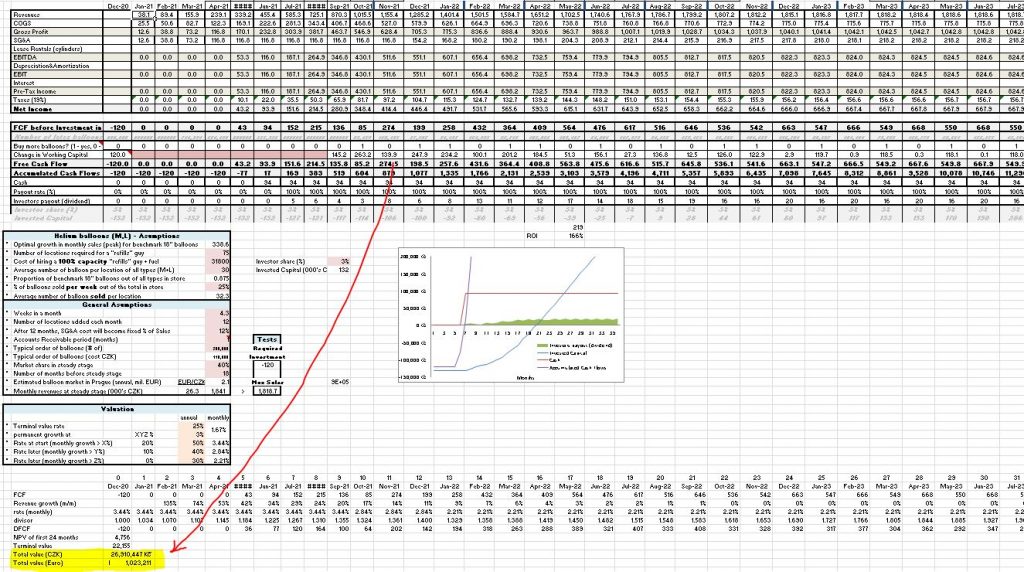
Discounted cash flows (DCF)
It is a technique in which one discounts future cash flows, generated by a given investment. The discount rate is determined by different risks, both internal and external to the business.

This is by far, the most complex method. It is also considered as most reliable valuation method for mature or close to maturity businesses. Having said this, its reliability relies on the quality of the analyst’s work.
To find the value of a given investment, an analyst needs to “know” the future. It is clear that no one really knows the future, at least not with a 100% certainty. Therefore, assumptions need to be made. If the analyst is a pedant who thinks broadly and deeply about the possible scenarios and their probability, then his assumptions will be more reliable than those made by some superficial amateur. But even if the analyst does his best, he is still just a human who is dealing with a great amount of uncertainty in his predictions.

Later, I will get back to this valuation method, and explain its cons in our current economic situation. For now, let us introduce the second most common technique: Valuation Ratios
Valuation Ratios
Functioning companies produce all kind of operational metrics of their activity. Many of these metrics can be found in their financial and operational reports. Among the popular metrics: earnings, sales, cash flows, EBIT, EBITA, EBITDA, leverage, EV, debt, equity, assets, market cap.
In essence, an investor takes some of these metrics and compares them to other similar companies or to previous metrics of the same company. Then he updates accordingly the price he is willing to pay for the stock. For example, if stock ABC has earnings of $100 and its stock’s market price is $5, then when earnings grow to $200 while everything else remains unchanged, this investor would be likely to pay a higher price for the stock. This example, of comparing earnings to the stock price, is one of the popular ratios: The Price to Earnings ratio, or simply PE ratio. Here are some of the most popular ratios:
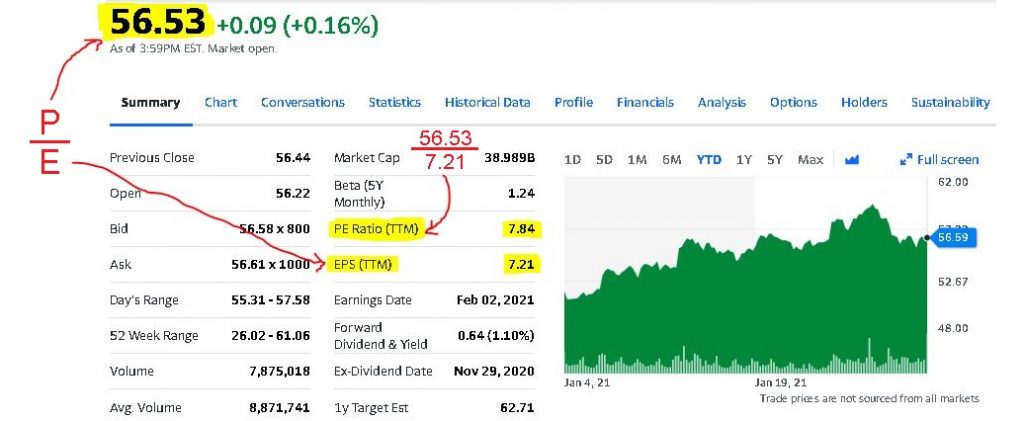
Price to Earnings ratio (PE ratio, P/E ratio)
Very popular for its simplicity, the P/E ratio compares the share price to the earnings per share (EPS). Anyone can do it. Professional background is not required.
High P/E usually means that the stock is expensive. This usually happens when investors have very big expectations about future earnings. This is common with growth stocks. Mature stocks, which pay hefty dividends, usually have low P/E. Companies in trouble also tend to have low to negative P/E.

It allows comparing between similar stocks and to the past performance of the same stock. Because earnings can be easily manipulated, this ratio is not very reliable. It can lead to a wrong conclusion. Nevertheless, it is one of the most popular not only among amateurs, but also among expert investors.
Price to Cash Flow ratio (P/CF ratio)
The P/CF ratio measures how much cash a company is generating relative to its market value.
It is a good alternative to the P/E ratio, since cash flows are less susceptible to manipulations with non-cash expenses like depreciation or amortization. Getting to cash flows requires some minimal extra effort though.
Price to Sales ratio (P/S ratio)
The stock price divided by sales per share. It is hard to play with its metrics, but it neglects to take into account profitability. Easy to use, but lacks the whole picture. Not a very reliable indicator on the stock’s performance.
It is useful when inspecting companies at their growth stage. If a company doubled its revenues, according to this ratio, the price should increase regardless of the costs involved. For the cautious investor this will not be enough of course.
EV/ EBITDA ratio
Enterprise Value to Earnings before Interest, Taxes, Depreciation, and Amortization ratio. It is so much shorter to just call it: EV/ EBITDA ratio. This is an operational ratio, which compares business activity to the whole enterprise and not just to equity.
As mentioned before, in the case of P/CF ratio, metrics as depreciation or amortization can mislead, especially in companies where these metrics are significant (usually with large investments into equipment). Here, additionally, interest and taxes are being dismissed to get the most accurate view on the value generated by the enterprise.
Price to Book ratio (P/B ratio)
When comparing the market price of a public company, one might want to see how far the price gone from the value which can be derived from the accounting statements (the “Book”). Financial statements are not about the future, thus the value there does not include expectations about future performance. The book value is usually very conservative – a “reality check” if you wish to shake off all the dreams and promises.

High P/B ratio means high expectations or high intangible value that investors assigned to the market price. Value investors, such as the famous Benjamin Graham in his book “The Intelligent Investor” (Chapter 14: Stock Selection for the Defensive Investor), urge to avoid stocks with extremely high P/B values.
Tesla Price to Book Ratio 2009-2020 | TSLA

I could discuss the differences between these and other ratios in length, but I don’t want to burden my readers with complex financial metrics and terminology. Let me just tell you that each of these ratios has its cons and pros, in terms of how easy to use each one of them and how flawed the result can be. All of them are susceptible to manipulations and wrong interpretation of results.
However, ratios make life easier not just for amateurs that do not know how to perform a fundamental thorough DCF valuation, but also to experts. Professional analysts can perform a solid base valuation at first, but as time progresses and the underlying investment does not change much, they can easily update their initial price by linking it to one of the ratios. For as long as the whole business does not change, they can just “update” the price according to increasing or decreasing ratios.
Interim Summary
I would like to summarize the weak points of these two valuation methods in terms of reliability.
While an error in DCF is usually caused by wrong assumptions, with ratios the problem lies in the metrics that can be inaccurate, purposely manipulated, or wrongly interpreted.
DCF is more accurate with mature businesses that have stable growth and clear estimates on their future cash flows. It is not easy to perform a reliable DCF on a rapidly growing and evolving business (startups, young companies, companies with unstable income). In such cases, it is better to find alternative ways to make an investment decision. Ratios not necessarily can help in a situation like this, though some analysts use very creative metrics to quantify future success. For example, internet social networks use the number of subscribers, words, images, clicks, or other variables, as a metric to value their networks.

In my next article, I will add growth companies and so-called “noise traders” to our discussion. I will come back to all valuation methods in the final, third article. There I will demonstrate how our present conditions influence the math behind valuations. I will also try to suggest a way to make investment decisions, despite the great uncertainty.


Very interesting and article has written easily to understand